
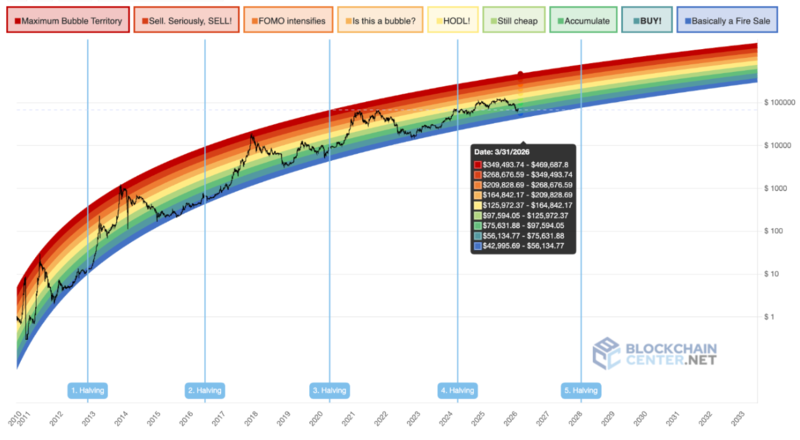
 ▲ Bitcoin Rainbow Chart/Source: BlockchainCenter |
As Bitcoin (BTC) continues to move sideways below the $70,000 level, the long-term cycle analysis indicator known as the “Rainbow Chart” suggests that the market could remain in an undervalued zone through the end of March.
According to cryptocurrency media outlet Finbold on March 8 (local time), Bitcoin is currently trading at around $67,535, down approximately 0.3% over the past 24 hours. On a weekly basis, however, it has risen about 1.5%, maintaining a partial recovery trend despite short-term corrections.
The Rainbow Chart is a model that visually analyzes Bitcoin’s long-term market cycles using logarithmic regression-based price bands. It explains Bitcoin’s historical price movements by dividing market phases into multiple stages, ranging from “extremely undervalued” to “bubble territory.”
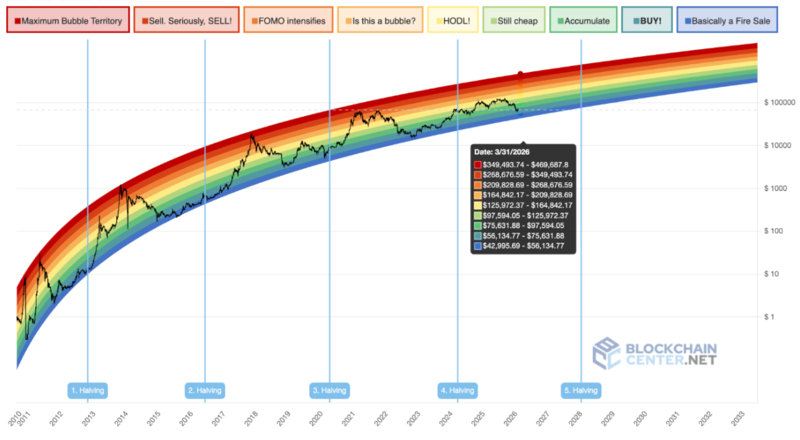
In the outlook for March 31, the lowest band, labeled “Basically a Fire Sale,” is set between approximately $42,995.69 and $56,134.77. Historically, this range has appeared when Bitcoin entered a severely undervalued state compared to its long-term trend. The next stage, “BUY!,” spans from $56,134.77 to $75,631.88 and is regarded as a price range where long-term investors tend to accumulate.
Currently trading at around $67,500, Bitcoin sits within the “BUY!” zone. From a long-term trend perspective, this suggests it remains undervalued. The subsequent “Accumulate” range extends from $75,631.88 to $97,594.05, described as the phase in which the market begins returning to a long-term upward trajectory.
According to the Rainbow Chart, areas closer to Bitcoin’s long-term “fair value” are the “Still Cheap” and “HODL!” zones. These price ranges are presented between approximately $97,594 and $164,842. Conversely, levels above $164,842 enter the “Is this a bubble?” and “FOMO intensifies” stages, which are considered signals of increasing market overheating.
However, the Rainbow Chart is not designed to precisely predict short-term price movements but rather to serve as a reference indicator for assessing Bitcoin’s position within its long-term market cycle. The outlet explained that the model is used as a visual framework to determine which stage of the long-term growth trajectory Bitcoin currently occupies.
*Disclaimer: This article is provided for investment reference purposes only, and no responsibility is assumed for any investment losses resulting from its use. The content should be interpreted for informational purposes only.*
답글 남기기